 Up
Up
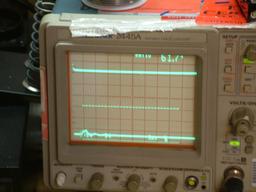
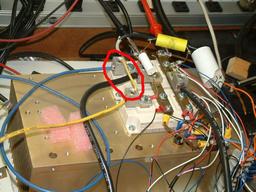
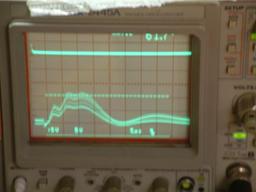
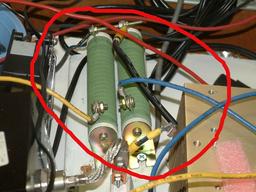
Here are the photos of my new inverter bridge. On these photos, you see the following:
The time scale is 5 microseconds per every division, the voltage scale is 5 volts per division. Switching frequency about 200 Hz.
My question is, how come the graphs are so different. My guess is that it is explained by the induction of the wirewound resistors. When the bridge shorts for a fraction of a microsecond (see the brief dip of DC-DC voltage in the beginning), the current rises, and when the bridge "unshorts", this current has no way to go.


